The study aimed to assess the extent of noise pollution in different areas within Jamalpur District Town. REED SD-4023 was used to measure noise levels from various sampling sites from January 1, 2021, to April 30, 2021. Several samples were collected from each sampling site. Every place's noise level measurement has been taken three times a day. Based on land uses, Jamalpur District Town was divided into 7 different zones and 60 places. The mean noise level and Leq were found to be 72.19 dBA and 94.36 dBA. The mean noise level and Leq for the Silent Area, Residential Area, Mixed Areas, Commercial Area, Industrial Area, Road Intersection, and Village Area were 69.70 dBA and 84.38 dBA; 70.78 dBA and 91.96 dBA; 77.28 dBA and 86.31 dBA; 77.27 dBA and 89.28 dBA; 70.56 dBA and 82.91 dBA; 79.12 dBA and 102.42 dBA; and 60.64 dBA and 93.25 dBA. The hierarchy of various land uses according to mean noise levels was road intersections > mixed areas > commercial areas > residential areas > industrial areas > silent areas > village areas. The three major areas with the highest levels of noise pollution were Foujdari Mor (107.72 dBA), Tennis Club Mor (107.39 dBA), and South Kachari Para (102.63 dBA). Conversely, the three major locations with the lowest noise pollution levels included Pinggol Hati (63.34 dBA), East Binondi Para (63.36 dBA), and Bichitro Para (63.83 dBA), as measured by Leq. It has been observed that the noise level had exceeded the National Standard Level in all the locations from this study.
| Published in | International Journal of Safety Research (Volume 1, Issue 1) |
| DOI | 10.11648/j.ijsr.20260101.15 |
| Page(s) | 28-41 |
| Creative Commons |
This is an Open Access article, distributed under the terms of the Creative Commons Attribution 4.0 International License (http://creativecommons.org/licenses/by/4.0/), which permits unrestricted use, distribution and reproduction in any medium or format, provided the original work is properly cited. |
| Copyright |
Copyright © The Author(s), 2026. Published by Science Publishing Group |
Noise Pollution, Jamalpur District Town, Land Use, Cluster, Dispersion, Noise Standard, Bangladesh
Land Use (N) | Mean | Minimum | Maximum | Standard Deviation | Range | Median | Leq | Rank |
|---|---|---|---|---|---|---|---|---|
Silent Area (10) | 69.70 | 45.60 | 111.90 | 11.26 | 66.30 | 69.80 | 84.38 | 6 |
Residential Area (10) | 70.78 | 48.00 | 121.60 | 10.96 | 73.60 | 69.80 | 91.96 | 4 |
Mixed Areas (3) | 77.28 | 50.80 | 99.80 | 10.49 | 49.00 | 77.90 | 86.31 | 2 |
Commercial Area (10) | 77.27 | 57.50 | 114.40 | 8.46 | 56.90 | 76.60 | 89.28 | 3 |
Industrial Area (10) | 70.56 | 47.00 | 96.70 | 10.50 | 49.70 | 70.00 | 82.91 | 5 |
Road Intersection (7) | 79.12 | 62.60 | 129.20 | 7.87 | 66.60 | 78.20 | 102.42 | 1 |
Village Area (10) | 60.64 | 37.90 | 123.60 | 13.81 | 85.70 | 58.10 | 93.25 | 7 |
Overall (60) | 72.19 | 37.90 | 129.20 | 12.27 | 91.30 | 71.50 | 94.36 | - |
(I) Land Use | (J) Land Use | Mean Difference (I-J) | Standard Error | Sig. |
|---|---|---|---|---|
Silent Area | Residential Area | -1.0854* | 0.27752 | 0 |
Mixed Areas | -7.5839* | 0.38968 | 0 | |
Commercial Area | -7.5751* | 0.26781 | 0 | |
Industrial Area | -.8654* | 0.27124 | 0.001 | |
Road Intersection | -9.4250* | 0.30208 | 0 | |
Village Area | 9.0524* | 0.26993 | 0 | |
Residential Area | Silent Area | 1.0854* | 0.27752 | 0 |
Mixed Areas | -6.4985* | 0.3978 | 0 | |
Commercial Area | -6.4897* | 0.27949 | 0 | |
Industrial Area | 0.22 | 0.28278 | 0.437 | |
Road Intersection | -8.3396* | 0.31248 | 0 | |
Village Area | 10.1379* | 0.28153 | 0 | |
Mixed Areas | Silent Area | 7.5839* | 0.38968 | 0 |
Residential Area | 6.4985* | 0.3978 | 0 | |
Commercial Area | 0.0088 | 0.39108 | 0.982 | |
Industrial Area | 6.7185* | 0.39344 | 0 | |
Road Intersection | -1.8411* | 0.4153 | 0 | |
Village Area | 16.6364* | 0.39254 | 0 | |
Commercial Area | Silent Area | 7.5751* | 0.26781 | 0 |
Residential Area | 6.4897* | 0.27949 | 0 | |
Mixed Areas | -0.0088 | 0.39108 | 0.982 | |
Industrial Area | 6.7097* | 0.27325 | 0 | |
Road Intersection | -1.8499* | 0.30388 | 0 | |
Village Area | 16.6276* | 0.27196 | 0 | |
Industrial Area | Silent Area | .8654* | 0.27124 | 0.001 |
Residential Area | -0.22 | 0.28278 | 0.437 | |
Mixed Areas | -6.7185* | 0.39344 | 0 | |
Commercial Area | -6.7097* | 0.27325 | 0 | |
Road Intersection | -8.5596* | 0.30691 | 0 | |
Village Area | 9.9179* | 0.27533 | 0 | |
Road Intersection | Silent Area | 9.4250* | 0.30208 | 0 |
Residential Area | 8.3396* | 0.31248 | 0 | |
Mixed Areas | 1.8411* | 0.4153 | 0 | |
Commercial Area | 1.8499* | 0.30388 | 0 | |
Industrial Area | 8.5596* | 0.30691 | 0 | |
Village Area | 18.4775* | 0.30576 | 0 | |
Village Area | Silent Area | -9.0524* | 0.26993 | 0 |
Residential Area | -10.1379* | 0.28153 | 0 | |
Mixed Areas | -16.6364* | 0.39254 | 0 | |
Commercial Area | -16.6276* | 0.27196 | 0 | |
Industrial Area | -9.9179* | 0.27533 | 0 | |
Road Intersection | -18.4775* | 0.30576 | 0 |
Land Use (N) | Location | Standard Value | Within Standard (%) |
|---|---|---|---|
Silent Area (10) | Assistant Director Office | 50 | 4.08% |
Bangladesh Agricultural Development Corporation | 0.00% | ||
Bangladesh Water Development Board | 0.00% | ||
DC Office | 0.00% | ||
Fulbaria Kolimulla Govt. Primary School | 0.00% | ||
Govt. Jaheda Shorif Women College | 4.40% | ||
Police Super Office | 0.00% | ||
Singhojani Bohumukhi High School | 12.07% | ||
Singhojani Girls High School | 0.00% | ||
Sri Sri Doamoyi Mondir | 0.00% | ||
Mean | 2.06% | ||
Residential Area (10) | Al-Jamiyatul Habibiyah Kowmi Madrasa | 55 | 0.00% |
Dewanpara | 0.00% | ||
Fulbaria Kolimulla Govt. Primary School | 47.06% | ||
Matrisonod | 11.28% | ||
Mia Para | 0.65% | ||
Modhubag Abashik | 3.68% | ||
Muslimbad | 0.00% | ||
North Kachari Para | 0.83% | ||
South Kachari Para | 0.00% | ||
West Fulbaria | 2.66% | ||
Mean | 6.62% | ||
Mixed Areas (3) | Rony Community Center | 60 | 24.92% |
Shah Jamal Mazar | 0.00% | ||
Shokal Bazar Boro Mosque | 0.00% | ||
Mean | 8.31% | ||
Commercial Area (10) | Central Bus Terminal | 70 | 16.62% |
Dhaka Potti | 0.00% | ||
Dorhi Para | 36.28% | ||
Gate Parth | 7.22% | ||
Medical College Road | 49.63% | ||
Puraton Powroshova Gate | 45.18% | ||
Raniganj Bazar | 40.21% | ||
Shaokal Bazar | 5.19% | ||
Tomal Tola | 1.74% | ||
Tomaltola | 5.21% | ||
Mean | 20.73% | ||
Industrial Area (10) | Al-Binruni Auto Rice Mill | 75 | 90.58% |
BD Chemical | 76.67% | ||
Elite Food Wear | 73.50% | ||
Ema Food Product | 71.27% | ||
Hossain Industry | 0.00% | ||
Mahbub Engineering Workshop | 63.67% | ||
Raja Food Products | 83.58% | ||
RCI LTD. | 96.77% | ||
Tarif Auto Flower Mill | 88.30% | ||
Zabed Agro Food | 89.45% | ||
Mean | 73.38% | ||
All Mean | 22.22% | ||
AC | Alternating Current |
BD | Bangladesh |
CAPS | Center for Atmospheric Pollution Studies |
dBA | A-Weighted Decibel |
DC | Deputy Commissioner |
DoE | Department of Environment |
GB | Gigabyte |
GIS | Geographic Information System |
Govt | Government |
Leq | Equivalent Continuous Sound Pressure Level |
Ltd | Limited |
MAX | Maximum |
MIN | Minimum |
N | Number (In Terms of Quantity) |
NIHL | Noise-Induced Hearing Loss |
PC | Personal Computer |
RCI | Regional Cooperation and Integration |
REC | Record |
SD | Secure Digital |
SPSS | Statistical Package for the Social Sciences |
WHO | World Health Organization |
| [1] | Islam Z, Abdullah F, Khanom M. Evaluation of traffic accessibility condition and noise pollution in Dhaka City of Bangladesh. Am J Traffic Transport Engineer. 2021; 6(2): 43-51. |
| [2] | Rao PR, Rao MGS. Community Reaction to Road Traffic Noise. Applied Acoustics. 1992; 37: 51-64. |
| [3] | United Nations Environment Programme (UNEP). Frontiers 2022: Noise, Blazes and Mismatches – Emerging Issues of Environmental Concern. Nairobi: UNEP; 2022. |
| [4] | Emran MGI, Mahmud S, Khan AH, Bristy NN, Das AK, Barma R, Barma A, Mita MH, Bosunia L, Rahman M, Roy M. Factors Influencing Stress Levels Among Students: A Virtual Exploration. European Journal of Medical and Health Sciences. 2024; 6(6): 67-75. |
| [5] | Alam MJB, Rauf, AFMA, Ahmed, MF. Traffic induced noise pollution in Dhaka City. J Civil Engineer. 2001; 29(1): 1-9. |
| [6] | Emran MGI, Ahmed KT, Khan AS, Rahman L, Momin MH, Das AK, Akter S, Saha M, Banerjee S, Ahmed T, Islam AFMM. Positive impacts of COVID-19 Lock down in Bangladesh: An online investigation. Heliyon. 2023; 9(10): 1-14. |
| [7] | Wongsurakiat P, Maranetra KN, Nana A, Naruman C, Aksornint M, Chalermsanyakorn T. Respiratory symptoms and pulmonary function of traffic policemen in Thonburi. J Med Assoc Thailand Chotmaihet Thangphaet. 1999; 82(5): 435-43. |
| [8] | Karita K, Yano E, Jinsart W, Boudoung D, Tamura K. Respiratory symptoms and pulmonary function among traffic police in Bangkok, Thailand. Arch Environ Health. 2001; 56(5): 467-70. |
| [9] | Shrestha I. Health effects of vehicular noise pollution on traffic police personnel in Kathmandu. Dissertation. Kolkata: Department of Environment Science, St Xavier’s College, 1998. |
| [10] | Shakya S. Health problems prevalent in the traffic police personnel due to vehicular air pollution in Kathmandu. Dissertation. Kathmandu: St Xavier’s College, 2001. |
| [11] | Tamura K, Jinsart W, Yano E, Karita K, Boudoung D. Particulate air pollution and chronic respiratory symptoms among traffic policemen in Bangkok. Arch Environ Health. 2003; 58(4): 201-7. |
| [12] | DeToni A, Finotto L. Respiratory diseases in a group of traffic police officers: Results of a 5-year follow-up. Giornale Italiano Med Lavoro Ergonomia. 2005; 27(3): 380-2. |
| [13] | Tripathi SR, Tiwari RR. Self-reported hearing quality of traffic policemen: A questionnaire-based study. Indian J Occupat Environ Med. 2006; 10(2): 82-4. |
| [14] | Majumder AK. Noise induced hearing quality assessments of traffic police personnel in Dhaka City. J Environ Pollut Human Health. 2018; 6(4): 121-5. |
| [15] | Majumder AK, Bhuiyan, ML, Akter, S. Status of noise pollution in different silent zone of Lalmatia residential area of Dhaka City. J SUB. 2016; 6(1): 81–91. |
| [16] | Majumder AK. Health impact assessment of noise pollution on traffic policemen of Kathmandu Valley, Nepal. Stamford J Environ Hum Habitat. 2012; 1: 120–32. |
| [17] | Majumder AK, Rauniyar R, Carter WS, Khanal SN, Bajracharya RM, Joshi SK. Noise induced hearing loss of Kathmandu valley traffic police: A self reported occupational health study. Bangladesh J Environ Sci. 2010; 18: 77-82. |
| [18] | World Health Organization. The world health report 2002: Reducing risks, promoting healthy life. Geneva: World Health Organization, 2002. |
| [19] | Nandi SS, Dhatrak SV. Occupational noise-induced hearing loss in India. Indian J Occupat Environ Med. 2008; 12(2): 53-6. |
| [20] | National Institute for Occupational Safety and Health. Criteria for a recommended standard: Occupational noise exposure. Cincinnati, OH: National Institute for Occupational Safety and Health, 1998. |
| [21] | World Health Organization. Occupational and community noise. Geneva: World Health Organization, 2001. |
| [22] | Islam, KMN, Majumder AK, Biswas, JD, Paul, B. Assessment of citizens perception towards traffic noise induced hearing loss in Dhaka City. Stamford J Civil Engineer. 2011; 3(1): 22-30. |
| [23] | Berger EH, Royster LH, Rozster JD, Driscoll DP, Layne M, eds. The noise manual, 5th ed. Fairfax, VA: American Industrial Hygiene Association, 2000. |
| [24] | Goelzer B, Hansen CH, Sehrndt GA, eds. Occupational exposure to noise: Evaluation, prevention and control. Geneva: World Health Organization, 2001. |
| [25] | Murthy VK, Majumder AK, Khanal SN, Subedi DP. Assessment of traffic noise pollution in Banepa, a semi urban town of Nepal. Kathmandu Univ J Sci Engineer Technol. 2007; 3(2): 12-20. |
| [26] | Bluhm G, Nordling E, Berglind N. Road traffic noise and annoyance: An increasing environmental health problem. Noise Health. 2004; 6(24): 43-9. |
| [27] | Meijer H, Knipschild P, Sallé H. Road traffic noise annoyance in Amsterdam. Int Arch Occupat Environ Health. 1985; 56: 285-97. |
| [28] | Ouis D. Annoyance caused by exposure to road traffic noise: An update. Noise Health. 2002; 4(15): 69-79. |
| [29] | Öhrström E. Longitudinal surveys on effects of changes in road traffic noise—annoyance, activity disturbances, and psycho-social well-being. J Acoust Soc Am. 2004; 115(2): 719-29. |
| [30] | De Hollander AE, van Kempen EE, Houthuijs DJ, Van Kamp I, Hoogenveen RT, Staatsen BA. Environmental noise: an approach for estimating health impacts at national and local level. Geneva: World Health Organization, 2004. |
| [31] | Majumder AK, Jilani MG. Assessing the Noise Pollution Level in Cumilla District Town, Bangladesh. GSC Advanced Research and Reviews. 2025; 23(3): 204-217. |
| [32] | Majumder AK, Bhuiyan MTA. Assessing the Extent of Noise Pollution in Laxmipur District Town, Bangladesh. International Journal of Environmental Monitoring and Analysis. 2025; 13(2): 61-73. |
| [33] | Majumder AK, Paul A, Ahamed MR. Assessment of Noise Pollution in Khulna City, Bangladesh. Am J Environ Sci Eng. 2025; 9(2): 86-97. |
| [34] | Majumder, AK, Mohammad, N. Evaluating the noise pollution levels in Feni District Town, Bangladesh. International Journal of Multidisciplinary Research and Development. 2025; 12(7): 52-60. |
| [35] | Majumder, AK, Sirajee, HMNH. Assessing the level of noise pollution in the town of Pabna, Bangladesh. International Journal of Academic Research and Development. 2025; 10(4): 13-21. |
| [36] | Majumder AK, Ullah MA, Shiddiqua S. Evaluation of Noise Pollution in Barisal, a Coastal City of Bangladesh. International Journal of Sustainable Development Research. 2025; 11(3): 166-179. |
| [37] | Majumder AK, Hossain MM, Hossain T. Evaluating the Level of Noise Pollution in the Town of Sirajganj, Bangladesh. International Journal of Sustainable and Green Energy. 2025; 14(3): 182-194. |
| [38] | Environmental Conservation Rules. Dhaka: Ministry of Environment and Forest, Government of the People’s Republic of Bangladesh, 2006. |
APA Style
Majumder, A. K., Islam, M. S. (2026). Evaluating the Level of Noise Pollution in the Town of Jamalpur, Bangladesh. International Journal of Safety Research, 1(1), 28-41. https://doi.org/10.11648/j.ijsr.20260101.15
ACS Style
Majumder, A. K.; Islam, M. S. Evaluating the Level of Noise Pollution in the Town of Jamalpur, Bangladesh. Int. J. Saf. Res. 2026, 1(1), 28-41. doi: 10.11648/j.ijsr.20260101.15
@article{10.11648/j.ijsr.20260101.15,
  author = {Ahmad Kamruzzaman Majumder and Mohammad Shamimul Islam},
  title = {Evaluating the Level of Noise Pollution in the Town of Jamalpur, Bangladesh},
  journal = {International Journal of Safety Research},
  volume = {1},
  number = {1},
  pages = {28-41},
  doi = {10.11648/j.ijsr.20260101.15},
  url = {https://doi.org/10.11648/j.ijsr.20260101.15},
  eprint = {https://article.sciencepublishinggroup.com/pdf/10.11648.j.ijsr.20260101.15},
  abstract = {The study aimed to assess the extent of noise pollution in different areas within Jamalpur District Town. REED SD-4023 was used to measure noise levels from various sampling sites from January 1, 2021, to April 30, 2021. Several samples were collected from each sampling site. Every place's noise level measurement has been taken three times a day. Based on land uses, Jamalpur District Town was divided into 7 different zones and 60 places. The mean noise level and Leq were found to be 72.19 dBA and 94.36 dBA. The mean noise level and Leq for the Silent Area, Residential Area, Mixed Areas, Commercial Area, Industrial Area, Road Intersection, and Village Area were 69.70 dBA and 84.38 dBA; 70.78 dBA and 91.96 dBA; 77.28 dBA and 86.31 dBA; 77.27 dBA and 89.28 dBA; 70.56 dBA and 82.91 dBA; 79.12 dBA and 102.42 dBA; and 60.64 dBA and 93.25 dBA. The hierarchy of various land uses according to mean noise levels was road intersections > mixed areas > commercial areas > residential areas > industrial areas > silent areas > village areas. The three major areas with the highest levels of noise pollution were Foujdari Mor (107.72 dBA), Tennis Club Mor (107.39 dBA), and South Kachari Para (102.63 dBA). Conversely, the three major locations with the lowest noise pollution levels included Pinggol Hati (63.34 dBA), East Binondi Para (63.36 dBA), and Bichitro Para (63.83 dBA), as measured by Leq. It has been observed that the noise level had exceeded the National Standard Level in all the locations from this study.},
 year = {2026}
}
TY  - JOUR
T1  - Evaluating the Level of Noise Pollution in the Town of Jamalpur, Bangladesh
AU  - Ahmad Kamruzzaman Majumder
AU  - Mohammad Shamimul Islam
Y1  - 2026/01/23
PY  - 2026
N1  - https://doi.org/10.11648/j.ijsr.20260101.15
DO  - 10.11648/j.ijsr.20260101.15
T2  - International Journal of Safety Research
JF  - International Journal of Safety Research
JO  - International Journal of Safety Research
SP  - 28
EP  - 41
PB  - Science Publishing Group
UR  - https://doi.org/10.11648/j.ijsr.20260101.15
AB  - The study aimed to assess the extent of noise pollution in different areas within Jamalpur District Town. REED SD-4023 was used to measure noise levels from various sampling sites from January 1, 2021, to April 30, 2021. Several samples were collected from each sampling site. Every place's noise level measurement has been taken three times a day. Based on land uses, Jamalpur District Town was divided into 7 different zones and 60 places. The mean noise level and Leq were found to be 72.19 dBA and 94.36 dBA. The mean noise level and Leq for the Silent Area, Residential Area, Mixed Areas, Commercial Area, Industrial Area, Road Intersection, and Village Area were 69.70 dBA and 84.38 dBA; 70.78 dBA and 91.96 dBA; 77.28 dBA and 86.31 dBA; 77.27 dBA and 89.28 dBA; 70.56 dBA and 82.91 dBA; 79.12 dBA and 102.42 dBA; and 60.64 dBA and 93.25 dBA. The hierarchy of various land uses according to mean noise levels was road intersections > mixed areas > commercial areas > residential areas > industrial areas > silent areas > village areas. The three major areas with the highest levels of noise pollution were Foujdari Mor (107.72 dBA), Tennis Club Mor (107.39 dBA), and South Kachari Para (102.63 dBA). Conversely, the three major locations with the lowest noise pollution levels included Pinggol Hati (63.34 dBA), East Binondi Para (63.36 dBA), and Bichitro Para (63.83 dBA), as measured by Leq. It has been observed that the noise level had exceeded the National Standard Level in all the locations from this study.
VL  - 1
IS  - 1
ER  -
Department of Environmental Science, Stamford University Bangladesh, Dhaka, Bangladesh;Center for Atmospheric Pollution Studies (CAPS), Chattogram, Bangladesh
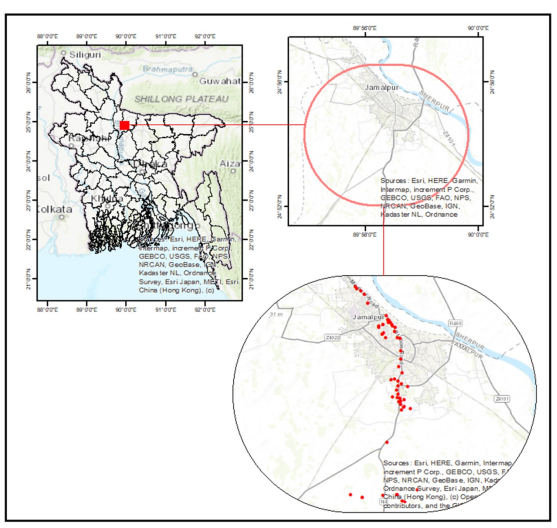
Figure 1. Study Area of Jamalpur District Town.
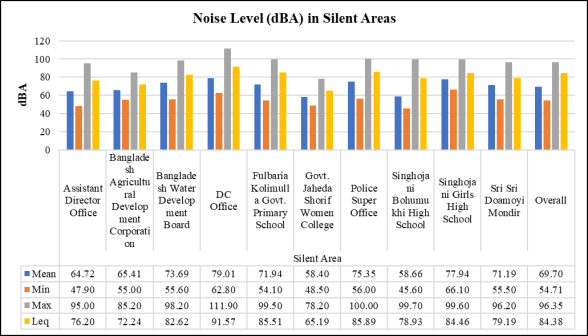
Figure 2. Noise Level (dBA) in Silent Areas.
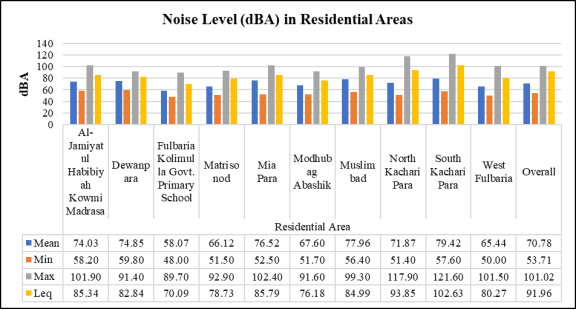
Figure 3. Noise Level (dBA) in Residential Areas.
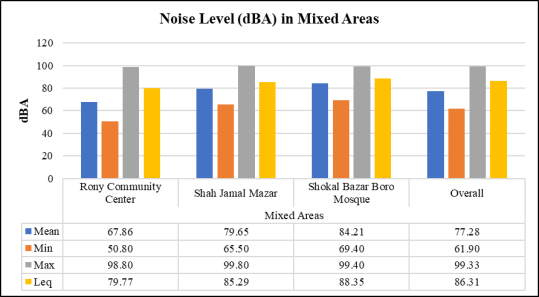
Figure 4. Noise Level (dBA) in Mixed Areas.
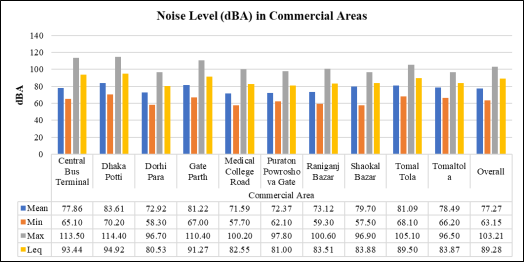
Figure 5. Noise Level (dBA) in Commercial Areas.
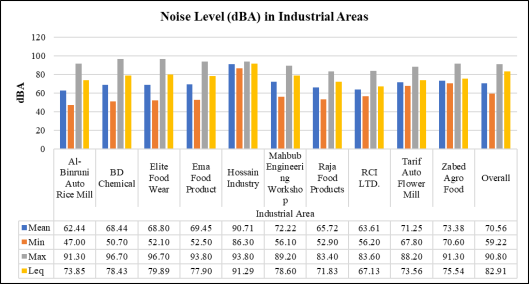
Figure 6. Noise Level (dBA) in Industrial Areas.
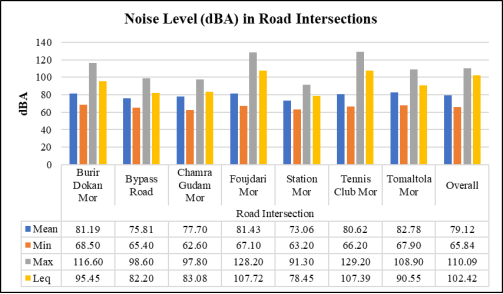
Figure 7. Noise Level (dBA) in Road Intersection.
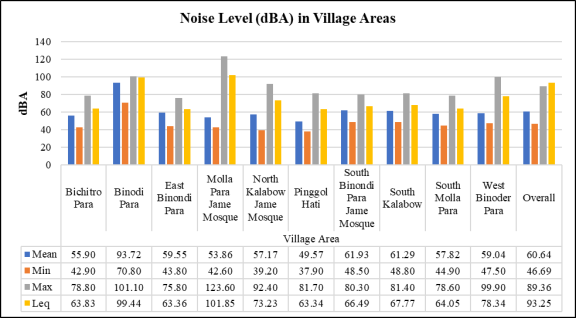
Figure 8. Noise Level (dBA) in Village Areas.
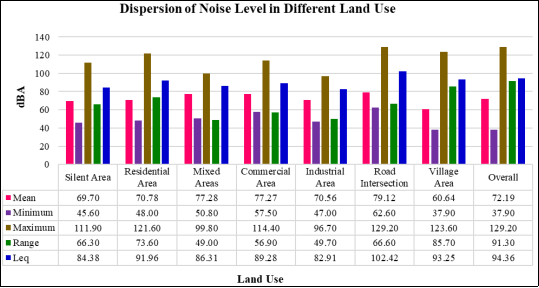
Figure 9. Dispersion of Noise Level in Different Land Use.
Figure 10. Mean Noise Pollution in Jamalpur District Town.
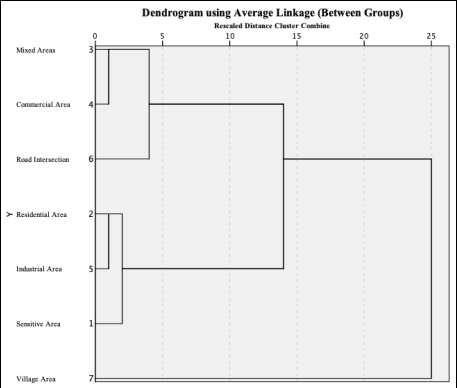
Figure 11. Land Use Based Cluster, in Terms of dBA.
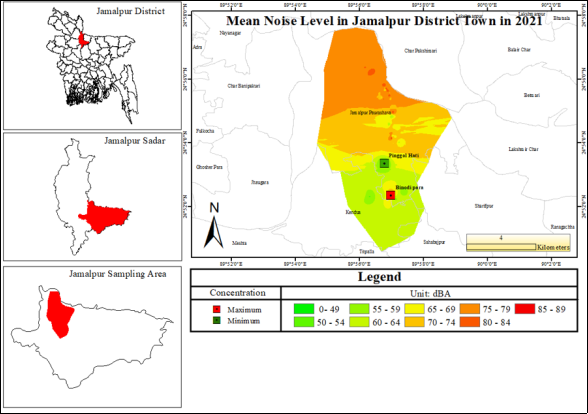
Figure 12. Spatial Map of Mean Noise Pollution.